
:quality(80)/business-review.eu/wp-content/uploads/2024/01/ZZY_1898.jpg)
:quality(80)/business-review.eu/wp-content/uploads/2023/12/huawei.png)
The Smartwatch Health Survey study has been conducted in 8 countries: the UK, Germany, Poland, Spain, Italy, Romania, Bulgaria, Turkey. In this report we are focusing on the Romanian market.
High interest in well-being and non-satisfied self-assessment in certain health related areas create a high potential for wearable smart devices with monitoring of health functionalities across all the countries.

There is a high level of interest in health among people in Romania. Approximately 90% of the populace shows interest in general wellbeing. The primary areas of focus include rest/calm, body/weight, and vitality, with over 90% expressing interest in these domains (refer to Chart 1 for more details). Specifically, the ability to rest, coping with stress, quality and quantity of sleep, body immunity, vitality/energy, ability to concentrate, and healthy eating rank among the top areas of interest. Interest is more pronounced among younger people, especially those aged 30-39, in areas such as body fat level, calorie consumption and burning, muscle mass, fitness and sport performance, beauty, and regular preventive examinations. Conversely, the older age group, those aged 50 and above, shows diminished interest in calorie consumption and burning, fitness/sports, and beauty. Women unveil a higher interest in almost all health-related areas, particularly in the ability to cope with stress, quality and quantity of sleep, healthy eating, weight control, calorie consumption, focus, beauty, and water-related areas. These topics, however, are significantly less appealing to males.
Chart 1: INTEREST IN HEALTH/ WELL-BEING

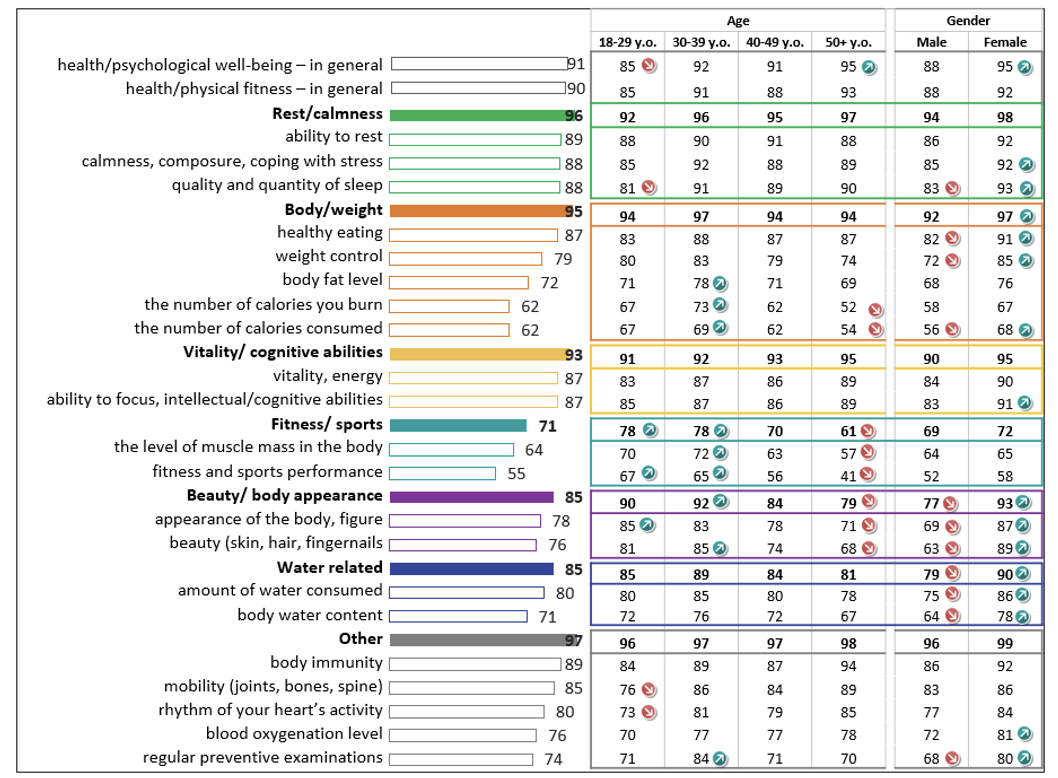
Sample size N=1000/187/228/268/317/498/502

Base: all respondents/18-29 y.o./30-39 y.o./ 40-49 y.o. /50+y.o./male/female
*People declaring rather/definitely interested
However, around half of the population is satisfied with their physical fitness or psychological wellbeing. Chart 2 highlights the areas where satisfaction is lowest, mainly in relation to weight management and fitness. Overall, satisfaction levels tend to be higher among 18–29-year-olds, specifically in terms of fitness performance, the level of muscle mass in the body, the number of calories consumed, and mobility. There is no significant difference in satisfaction levels based on gender.
Chart 2: 10 LEAST SATISFIED AREAS OF HEALTH/ WELL-BEING
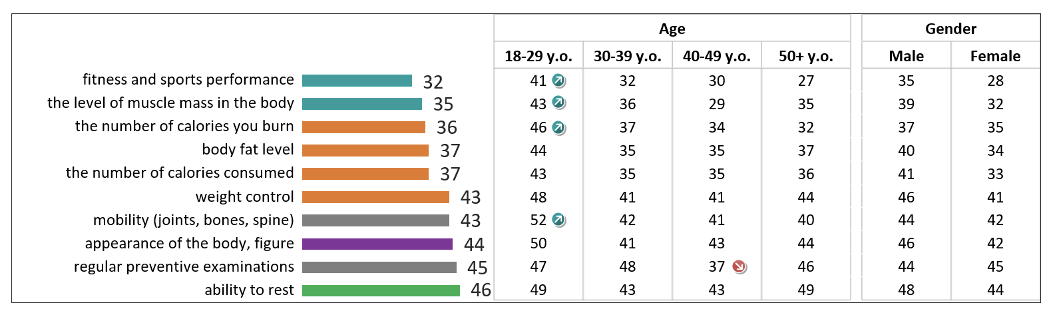
Sample size N=1000/187/228/268/317/498/502
Base: all respondents/18-29 y.o./30-39 y.o./ 40-49 y.o. /50+y.o./male/female
*People declaring rather/definitely satisfied
In Romania, based on declarative data, approximately 17% of the population is classified as obese, which is significantly lower compared to the rates in the UK, Germany, and Bulgaria. However, the obesity rate is on the same level as in Poland. Additionally, Chart 3 indicates that 33% of the population in Romania is overweight. The prevalence of obesity and overweight tends to increase with age and becomes significantly pronounced among individuals aged 50 and above. It is noteworthy that men in Romania are more likely to be obese and overweight, while women are significantly less likely.
Chart 3: WEIGHT: BODY MASS INDEX
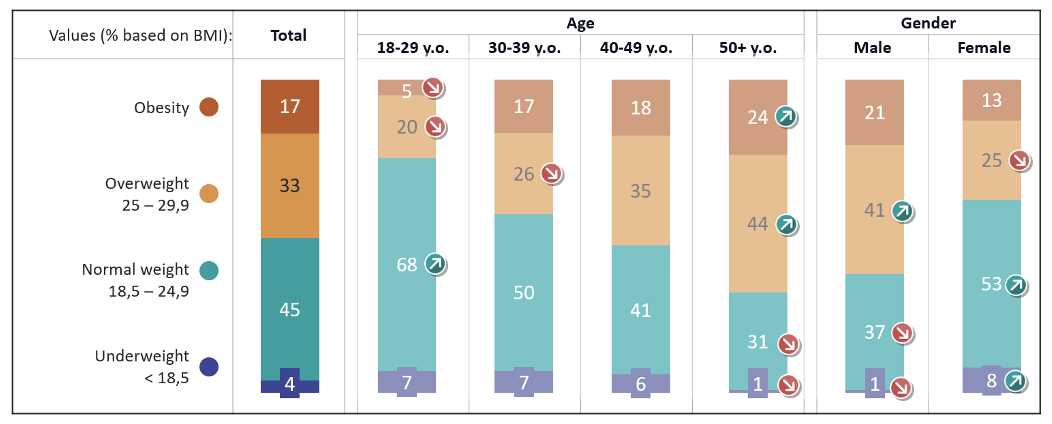
Sample size N=995/183/228/267/317/494/501
Base: all respondents/18-29 y.o./30-39 y.o./ 40-49 y.o. /50+y.o./male/female, who self-reported height and weight data
*Calculated based on self-reported height and weight provided by the respondents
A vast majority (88%) of Romanians experience at least one symptom related to a deterioration in their physical or psychological well-being. Chart 4 shows the 15 most common symptoms, with problems such as stress, worries, restlessness, and sleep disturbances being the most common. Problems with weight control and a decline in general physical fitness and mobility are also common. Among women, symptoms such as difficulty coping with stress, weight control issues, deterioration in the appearance of the body, skin, and hair are more common. People aged 50 and over are more likely to experience a decline in mobility and general physical fitness, improper levels of body fat, and irregular performance of preventive examinations. On the other hand, younger people aged 18-29 are more likely to have fewer problems with weight control, mobility, fitness/sport performance, body fat levels, and performing preventive examinations. Those aged 30-39 experience the highest levels of stress and worry.
Chart 4: 15 MOST EXPERIENCED SYMPTOMS
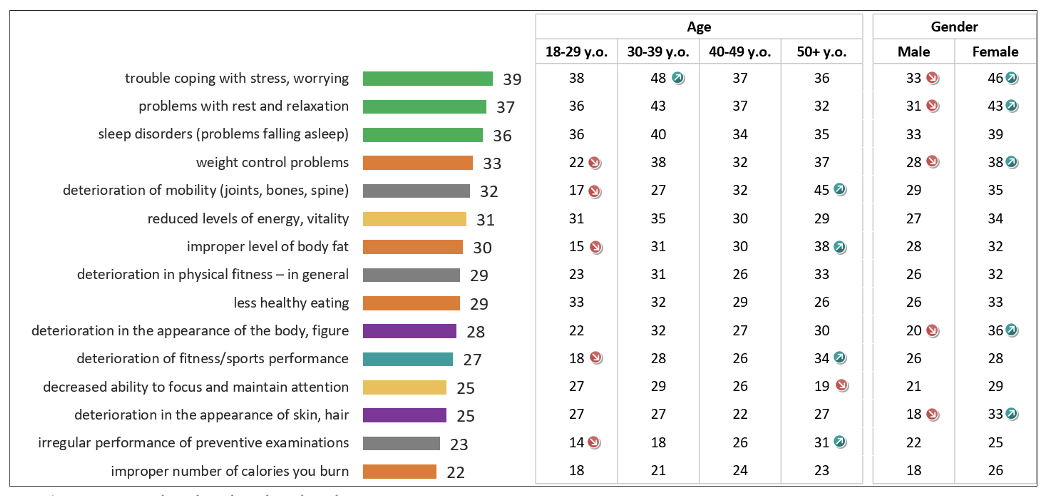
Sample size N=1000/187/228/268/317/498/502
Base: all respondents/18-29 y.o./30-39 y.o./ 40-49 y.o. /50+y.o./male/female
Strong understanding that lifestyle affect health among people
Most people in Romania (87%) understand that lifestyle significantly impacts their health, and this understanding is especially pronounced among people aged 50 and above, while it is less pronounced among younger age groups, as shown in Chart 5.
Chart 5: LINK BETWEEN LIFESTYLE AND HEALTH
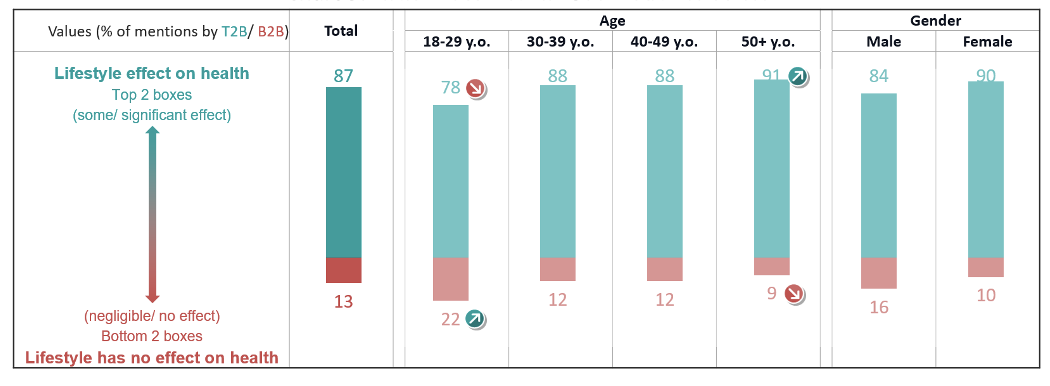
Sample size N=1000/187/228/268/317/498/502
Base: all respondents/18-29 y.o./30-39 y.o./ 40-49 y.o. /50+y.o./male/female
The high level of awareness doesn’t necessarily translate into the widespread incorporation of healthy habits into Romanians’ daily routines. Around 60% of people in Romania incorporate relatively simple habits into their lifestyle, such as limiting or avoiding alcohol and stimulants (61%) and drinking enough water (57%). Around 50% said they had lifestyle behaviors such as maintaining social contacts (55%), remaining calm and composed (55%), eating regularly (53%), getting the right amount of sleep (49%), taking rest breaks (48%), and eating healthier (47%). Only 44% said they maintain the right weight, 38% get regular medical exams (a relatively low percentage compared to other countries surveyed, similar to the UK), and only 34% are satisfied with the way they look. When comparing different age groups, the youngest group (18-29 years old) is more likely to exercise each day or practice sports regularly and be happy with the way they look, while those aged 30-39 are less likely to drink enough water, maintain social contacts, and remain calm and composed. It’s worth noting that women are more likely to avoid or limit alcohol or stimulants than men (the data is shown in Chart 6).
Chart 6: LIFESTYLE CHARACTERISTICS APPLIES TO ME
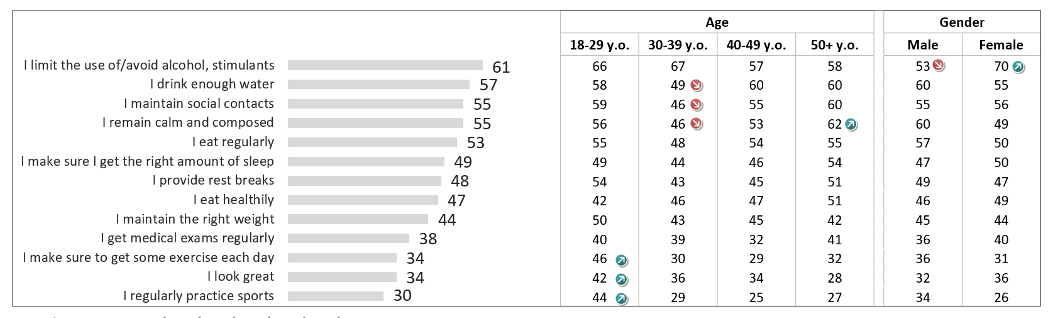
Sample size N=1000/187/228/268/317/498/502
Base: all respondents/18-29 y.o./30-39 y.o./ 40-49 y.o. /50+y.o./male/female
*People declaring mostly /definitely applied
Most people want to improve their health and well-being
Currently, 95% of Romanians say they would like to make at least one health-related change to their lifestyle. The top priorities for improvement include reducing stress, maintaining the right weight, eating healthier and practicing regular sports. Other aspects such as getting enough sleep and looking better are also mentioned, as shown in Chart 7. People aged 30-39 would like to reduce stress, exercise regularly and take breaks, while those aged 50 and over would like to maintain the right weight and are less interested in exercising regularly, taking breaks, and drinking enough water. However, women tend to express a greater desire to make changes, particularly in relation to maintaining the right weight, looking better, and drinking enough water. These findings highlight the complex relationship individuals have with their health goals. While the importance of these aspects is recognized, individual preferences and motivations may differ.
Chart 7: EXPECTED CHANGES IN HEALTH-RELATED LIFESTYLE
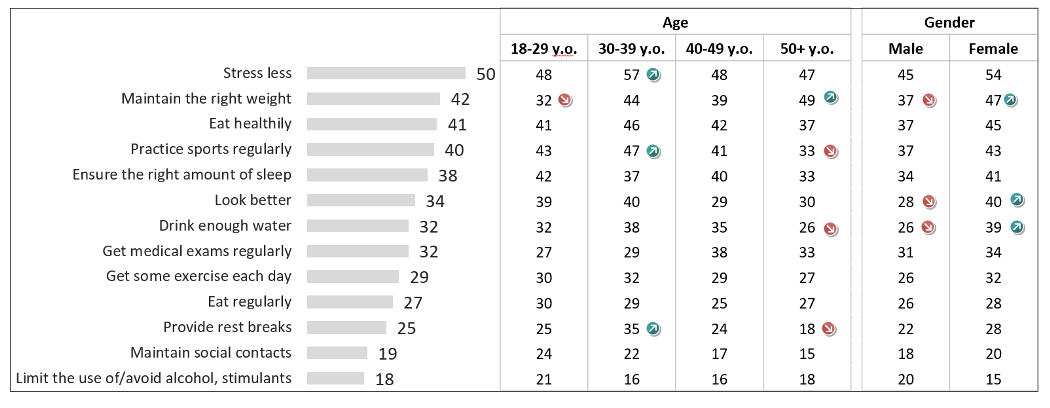
Sample size N=1000/187/228/268/317/498/502
Base: all respondents/18-29 y.o./30-39 y.o./ 40-49 y.o. /50+y.o./male/female
People believe that monitoring of health indicators is effective in helping to control their health condition and maintain the quality of life
Around 90% of Romanians (the highest level compared to other countries and is similar to Turkey) believe that monitoring health indicators can be beneficial in maintaining good health. They believe it allows for the detection of many diseases and health problems, tracking the progress of treatment, preventing diseases, maintaining control over the body and health, promoting preventive activities, adapting treatment to individual needs, and motivating people to lead a healthier lifestyle. The youngest group selected the fewest reasons, which may be due to their lower commitment to improving their health. A detailed list of reasons for tracking health metrics can be found in Chart 8.
Chart 8: REASONS FOR TRACKING HEALTH METRICS
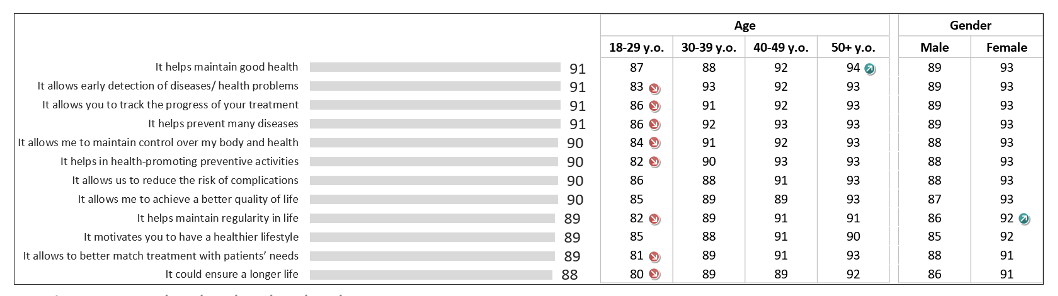
Sample size N=1000/187/228/268/317/498/502
Base: all respondents/18-29 y.o./30-39 y.o./ 40-49 y.o. /50+y.o./male/female
As seen above, most people in Romania have a good understanding of the reasons for monitoring health indicators. However, a somewhat lower percentage (73%) consider it important, with the youngest 18–29-year-olds being significantly less likely to consider it important and those aged 50 and over being significantly more likely. This suggests that while Romanians are aware of the potential benefits of tracking health metrics, their importance may vary between age groups, as shown in Chart 9.
Chart 9: IMPORTANCE OF MONITORING HEALTH INDICATORS
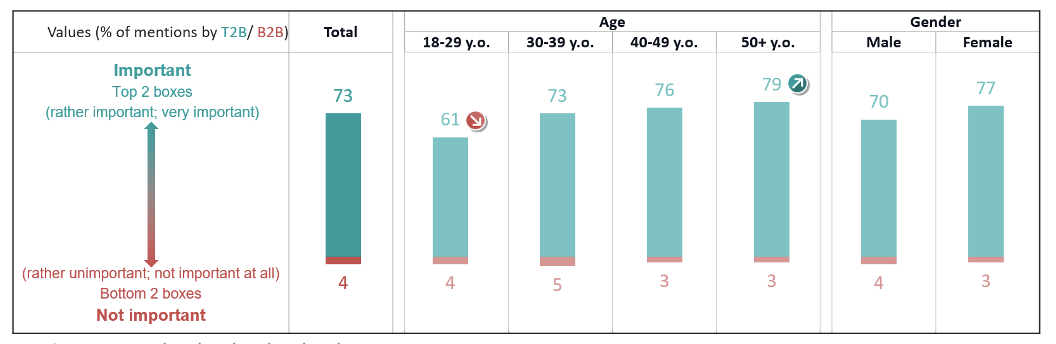
Sample size N=1000/187/228/268/317/498/502
Base: all respondents/18-29 y.o./30-39 y.o./ 40-49 y.o. /50+y.o./male/female
*Top 2 boxes: people declaring rather/very important; Bottom 2 boxes: people declaring rather/ not important at all
In Chart 10a, the top six health indicators considered important are highlighted in blue. These include blood pressure, blood sugar level, heart rate/pulse, cholesterol, sleep quality/quantity, and stress level. Among the oldest age group top four indicators are more likely to be considered important compared to any other age group. Conversely, the youngest respondents were less likely to consider those metrics as important for them, but more likely to emphasize the importance of monitoring physical activity level, number of calories burned, and the level of muscle mass in the body. Additionally, women aged 30-39 find it more important to track their menstrual cycle. There are no differences based on gender. The specific health indicators highlighted in Chart 10a reflect the areas of focus that individuals consider important in tracking their health.
Chart 10a: HEALTH METRICS IMPORTANCE
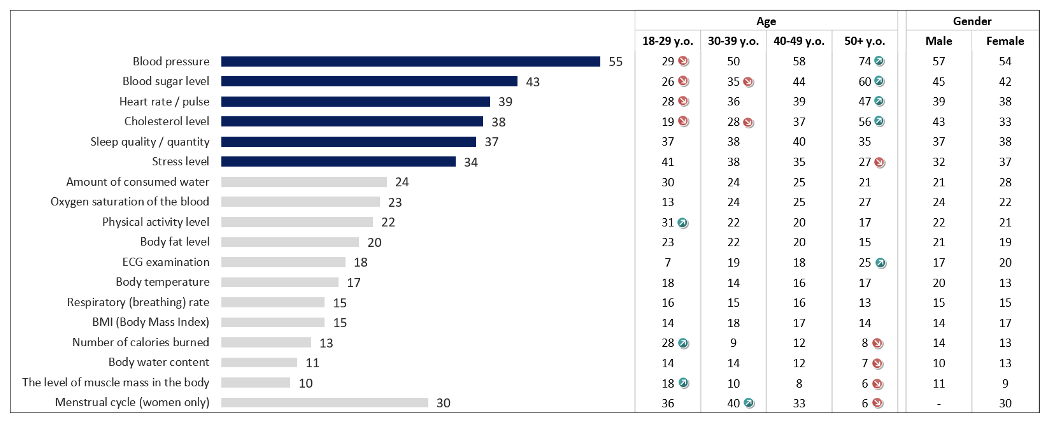
Sample size N=1000/187/228/268/317/498/502
Base: all respondents/18-29 y.o./30-39 y.o./ 40-49 y.o. /50+y.o./male/female
*The data by “Menstrual cycle” statement is shown only by woman base size (N=497/104/140/140/114 respondents)
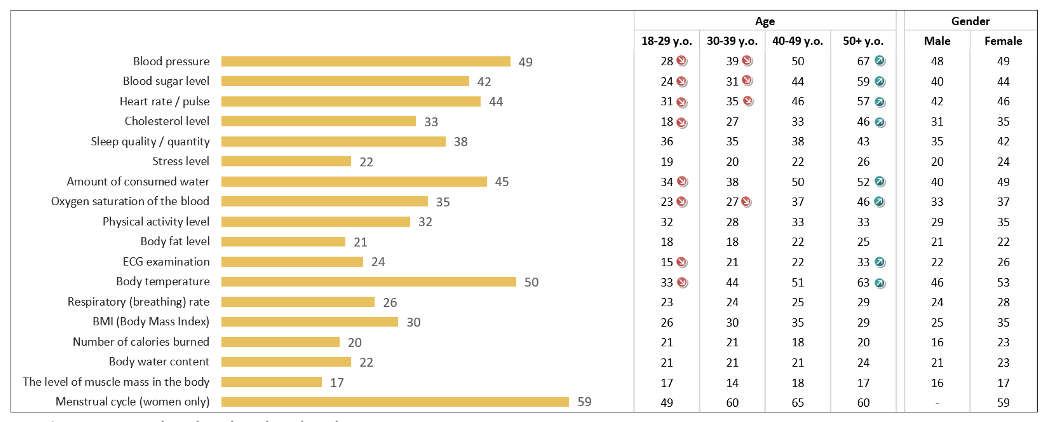
In general, there is a lack of knowledge among people about the appropriate levels of even the most basic health indicators, such as body temperature (with only 50% of individuals being aware of the optimal range) and sleep quantity/quality (38% are aware of the optimal range). Familiarity with the correct values for any given metric does not exceed half of the respondents in Romania, with the exception of the menstrual cycle (59% of women are aware of what their menstrual cycle should be). It is worth noting that Romanians have average familiarity with almost all health metrics compared to other countries, such as Poland and Italy. Respondents aged 50 and over show better knowledge of the health indicators that are important to them and are additionally more aware of the amount of consumed water, oxygen saturation of the blood, ECG examination, and body temperature. On the other hand, younger people are generally less aware of these health indicators, as shown in Chart 10b.
Chart 10b: HEALTH METRICS FAMILIARITY
Sample size N=1000/187/228/268/317/498/502
Base: all respondents/18-29 y.o./30-39 y.o./ 40-49 y.o. /50+y.o./male/female
*The data by “Menstrual cycle” statement is shown only by woman base size (N=497/104/140/140/114 respondents)
The data are presented as share of respondents, who have chosen statement 4 “I know it, and I know what the value should be right for me”
This lack of knowledge creates uncertainty for people about which metrics to monitor to address their specific concerns and focus on areas they would like to improve
Indicators with a relatively high level of knowledge include body temperature (50%), blood pressure (49%), amount of water consumed (45%), heart rate/pulse (44%), blood sugar level (42%), sleep quantity and quality (38%), oxygen saturation of the blood (35%), cholesterol levels (33%), physical activity level (32%), and BMI (body mass index) (30%).In the case of those with an average level of awareness (about 20% of those who know), there are indicators such as respiratory rate (breathing) (26%), ECG examination (24%), stress level (22%), body water content (22%), body fat level (21%), and number of calories burned (20%).
Despite the lack of knowledge about certain health metrics, it is interesting to note that more than half of the Romanian population tends to monitor certain metrics more regularly, at least once a month. These include water consumption, level of physical activity, heart rate/pulse, blood pressure and quality/quantity of sleep. Conversely, all other metrics are monitored less frequently, with body temperature, blood glucose and cholesterol levels typically checked once a quarter or once a year by a third of the population. Metrics such as the number of calories burned, respiratory rate, stress levels and BMI (body mass index) are checked by around 40% of the population either once a month or more, or rarely (once every two years or less). Other measures are more likely to be checked less frequently, such as once every two years or even less. Younger people aged 18-29 are more accustomed to checking their health metrics more often than other age groups. On the other hand, people aged 50 and over tend to check these health indicators much less frequently. The reference data are shown in Chart 11 below.
Chart 11: HEALTH METRICS TRACKING FREQUENCY
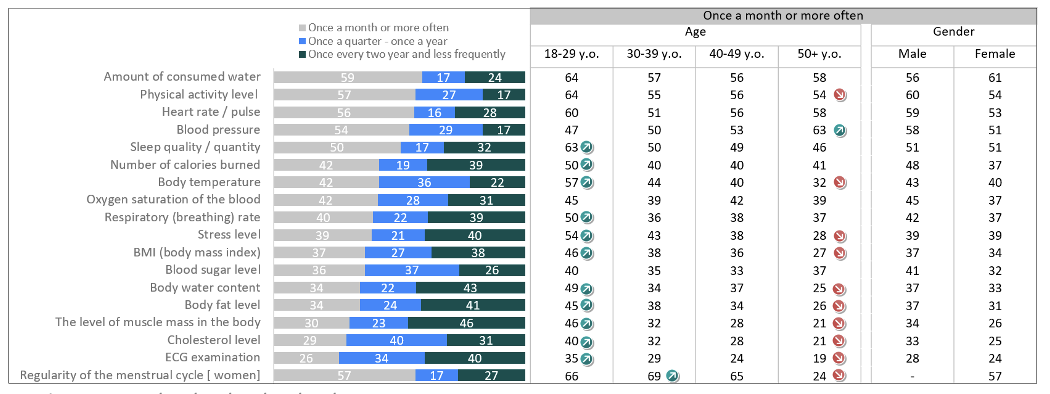
Sample size N=1000/187/228/268/317/498/502
Base: all respondents/18-29 y.o./30-39 y.o./ 40-49 y.o. /50+y.o./male/female
*The data by “Menstrual cycle” statement is shown only by woman base size (N=497/104/140/140/114 respondents)
It is worth acknowledging that greater knowledge and the importance of measuring health indicators are observed among regular smartwatch users. There are some health indicators that are perceived as slightly more important for non-users, such as blood pressure, cholesterol level, blood sugar level, and heart rate/pulse. The comparative data below (refer to Table 1) highlight the benefits of regularly monitoring health metrics and the role that technology, specifically smartwatches, plays in fostering this awareness and usage.
Table 1: SMARTWATCH REGULAR USERS VS NON-USERS BY KEY HEALTH METRICS INDICATORS
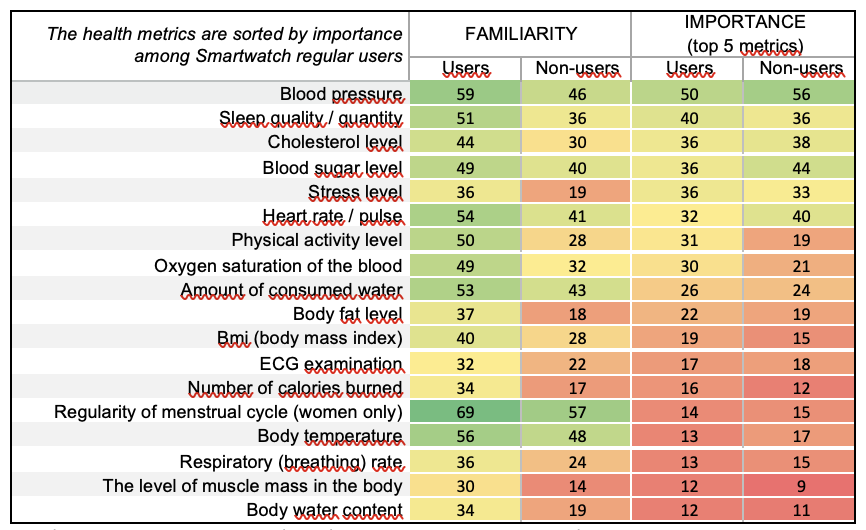
Sample size: N=179 Base: smartwatch regular users; N=821 Base: smartwatch non-users
More than a third of the population in all countries own a smartwatch, with Romania having the lowest level of ownership of all the countries surveyed
Smartwatches, one of the most commonly used devices for monitoring specific health indicators, are owned by 30% of Romanian respondents, while 54% of people do not own any type of wearable smart device. Respondents aged 50 and over are less likely to own a smartwatch or any other type of wearable smart device compared to other age groups. Ownership of smartwatches is significantly higher among younger people aged 30-39, as shown in Chart 12.
Chart 12: WEARABLE SMART DEVICES OWNERSHIP
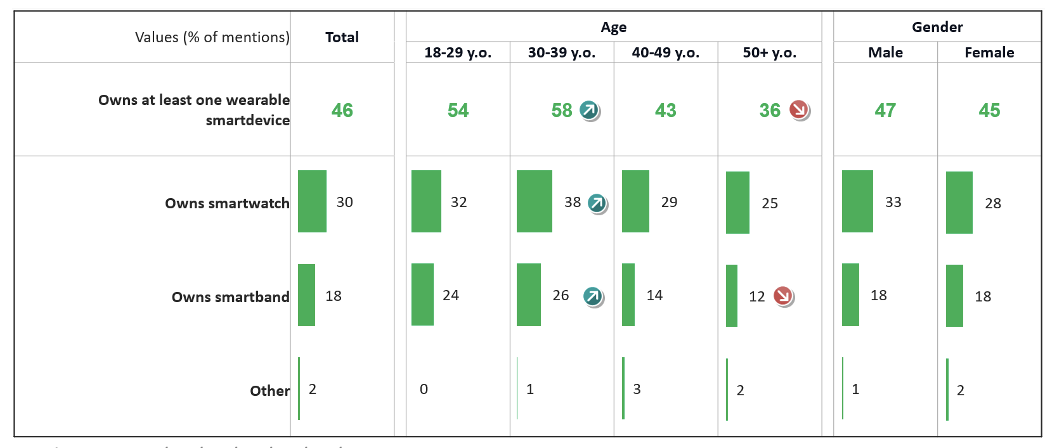
Sample size N=1000/187/228/268/317/498/502
Base: all respondents/18-29 y.o./30-39 y.o./ 40-49 y.o. /50+y.o./male/female
Not all smartwatch users use their devices regularly
The Romanian userbase exhibits the highest share of occasional usage of owned devices. Only 59% of users use them regularly, which is the lowest percentage compared to other countries, while high number of users (39%) use smartwatches from time to time, as shown in Chart 13.
Chart 13: SMARTWATCH USAGE FREQUENCY
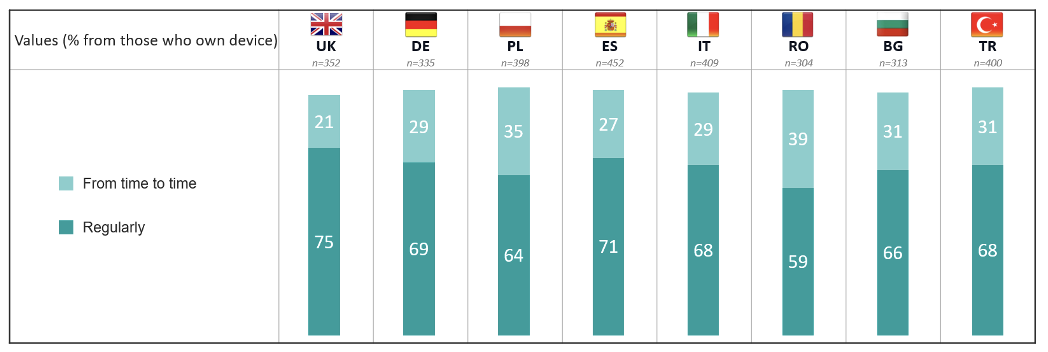
Sample size is indicated on the Chart per each country, Base: smartwatch owners
There is a high share of people who are not familiar with the health functionalities of smartwatches
Although smart devices offer a wide range of health tracking solutions, it is important to note that only 11% of all Romanian respondents feel familiar with the health-related functionalities of smartwatches. This lack of familiarity is not surprising, as even among smartwatch users, 11% don’t feel knowledgeable about the health-tracking features of their devices. Interestingly, familiarity with smartwatch health features tends to be higher among younger respondents aged 18-39. On the other hand, older respondents, in particular those over 50, report lower levels of familiarity with these features. The corresponding data is shown in Chart 14.
Chart 14: SMARTWATCH HEALTH-RELATED FUNCTIONALITIES AWARENESS
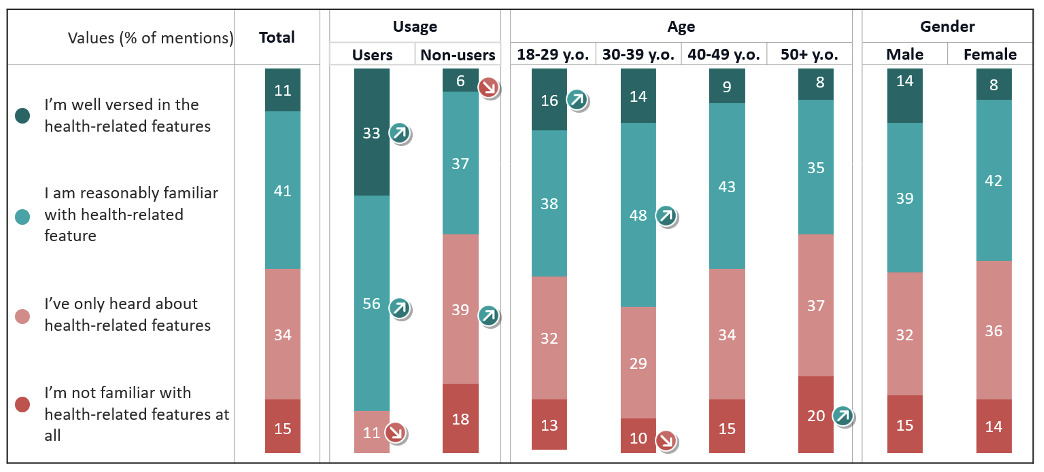
Sample size N=1000/187/228/268/317/498/502
Base: all respondents/smartwatch regular users/smartwatch non-users/18-29 y.o./30-39 y.o./ 40-49 y.o. /50+y.o./male/female
Heart rate measurements and physical activity monitoring are among the most familiar health functionalities of smartwatches mentioned spontaneously by people in both Romania and other countries
Among respondents who were at least somewhat familiar with the health features of smartwatches, the most commonly cited features were heart rate monitoring and physical activity tracking, with awareness levels of 62% and 51% respectively. Other features such as blood oxygen saturation index and blood pressure monitoring were mentioned by 26% of respondents, while sleep quality and quantity monitoring was mentioned by 25% and calories burned by 20%. On average, respondents mentioned two-tree features. Unsurprisingly, awareness was higher among smartwatch users than non-users, at 89% and 43% respectively.
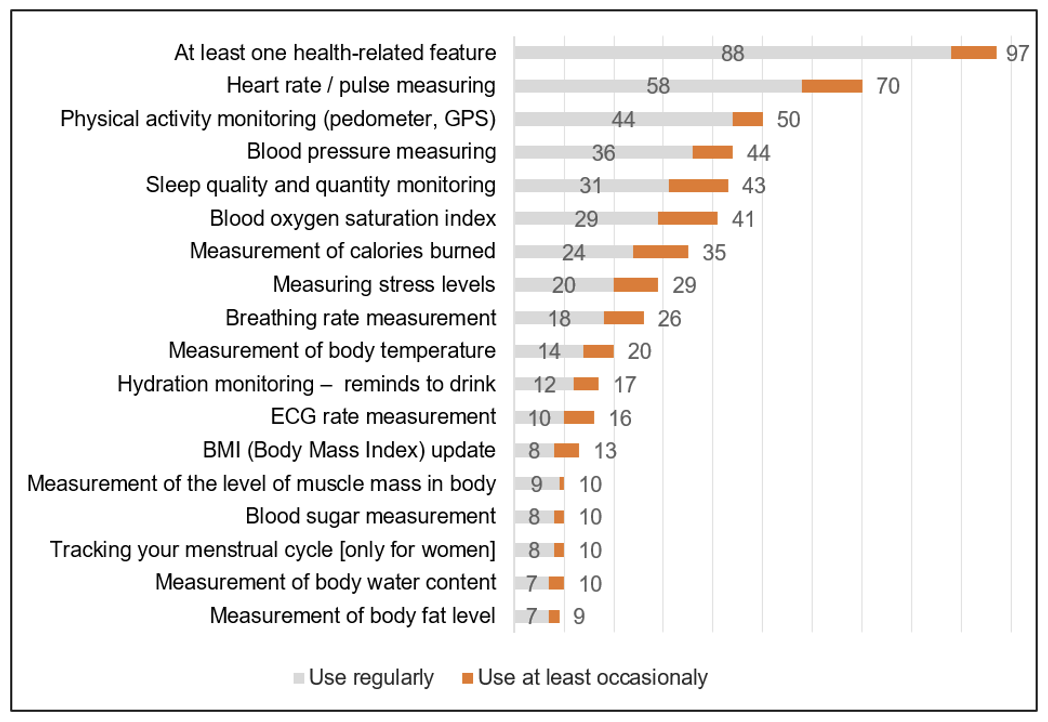
It is worth noting that 9 out of 10 smartwatch users use at least one health function on their smartwatches. The most commonly used functions are the same as those they identified as most familiar in their spontaneous responses. These functions include heart rate/pulse measurement, physical activity tracking, blood pressure measurement, sleep quality and quantity monitoring, and blood oxygen saturation index. In Romania, more than a third of smartwatch users also use features such as measuring calories burned, while measuring stress levels is used occasionally by a third of people.
Regular users of smartwatches tend to primarily utilize the most popular health functionalities regularly. However, exploring the lesser-known features of smartwatches could offer individuals the opportunity to take even better care of their health (Chart 15).
Chart 15: REGULAR AND OCCASIONAL USAGE OF SMARTWATCH HEALTH FUNCTIONALITIES
Sample size N=179 Base: smartwatch regular users
The list of most common functionalities of owned smartwatches includes heart rate/pulse monitoring (80%), physical activity monitoring (68%), sleep quality and quantity tracking (58%), blood pressure measurement (56%), measuring calories burned (56%), and blood oxygen saturation index (55%). These functionalities are also among the functions considered to be the most important for smartwatches (refer to Chart 16).
Chart 16: WEARABLE SMART DEVICES BUILT-IN AND CRUCIAL FUNCTIONS
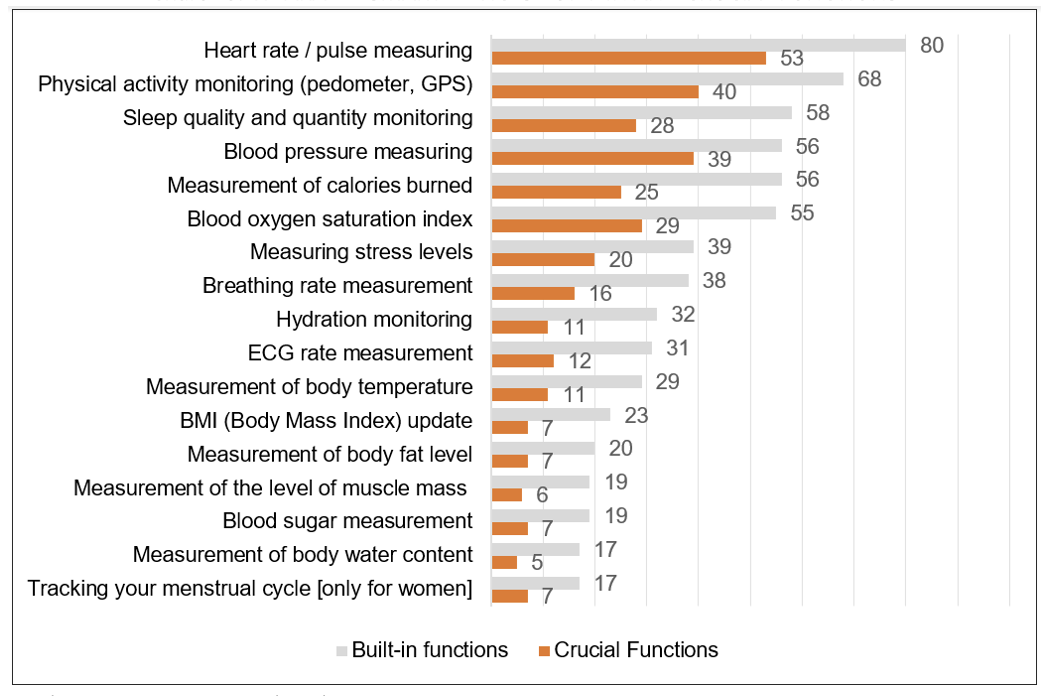
Sample size N=179 Base: smartwatch regular users
The same functionalities, including physical activity monitoring, heart rate/pulse measuring, and measurement of calories burned, are checked daily by about 50% of smartwatch regular users. On the other hand, sleep quantity/quality monitoring, blood pressure measuring, and blood oxygen saturation index are checked daily by a third of smartwatch regular users. These functionalities are among those checked much more frequently, except for sleep quantity/quality measuring (checked on average once per day), but also measuring stress level and hydration monitoring (averaging two to three times per day).
Smartwatch users are still missing some functions, and on average, they named more functions than users in other countries. The most frequently mentioned functionalities are measurements of blood sugar (40%), body fat level (37%), body water content (36%), the level of muscle mass (33%), body temperature (32%), ECG rate (30%), and BMI (Body Mass Index) (30%).
Health functionalities in smartwatches are considered as important features by regular users. Most users take notifications seriously and prefer to handle them on their own or search for more information on the Internet, rather than immediately consulting a doctor.
For 84% of regular users of smartwatches, the health-related features of smartwatches were an important factor that contributed to their decision to buy the device. A slightly smaller percentage (74%) claimed that the analysis and suggestions from their watches have influenced them to make changes in their lives, showing a higher response compared to any country except for Turkey, but at a similar level to the UK. On the other hand, most users consider the information from their smartwatches to be clear, transparent, and reliable. When it comes to responding to notifications, most users prefer to handle them on their own or search for more information on the Internet, rather than immediately consulting a doctor.
Most regular smartwatch users noticed the change of their behavior influenced by their smartwatch notifications.
At the same time, smartwatches prompted 85% of Romanian users to change their behavior, resulting in an average of 1.8 new activities. Among the users, 52% increased their exercise routine, 43% started to prioritize better sleep habits, while 39% started exercising more. In addition, 28% started taking more breaks at work, and 26% made changes to their diet.
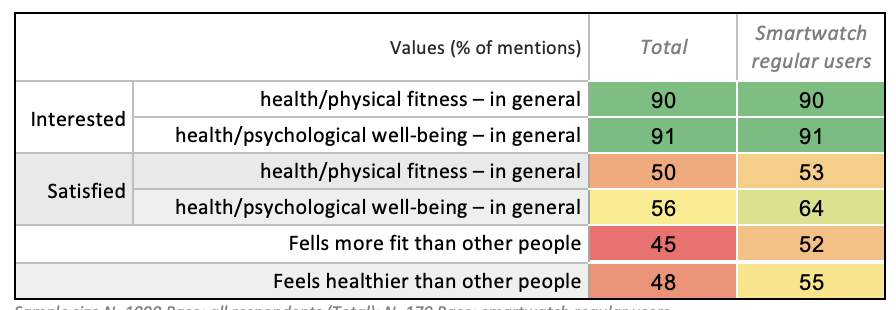
Although the level of interest and satisfaction with overall physical and mental well-being is similar among users and the general population, users tend to feel fitter and healthier (see comparable data in Table 2 below).
Table 2: REGULAR SMARTWATCH USERS VS NON-USERS BY WELL-BEING
Sample size N=1000 Base: all respondents (Total); N=179 Base: smartwatch regular users
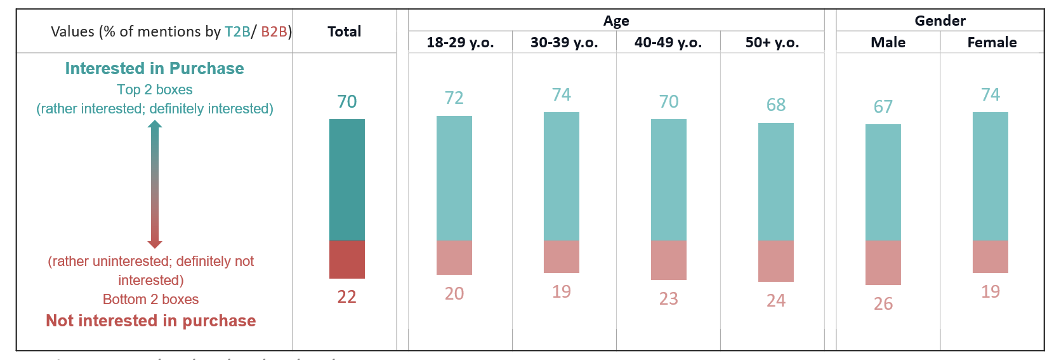
Smartwatch non-owners are eager to purchase smartwatch that improve their health.
It is noteworthy that there is a high level of purchase intention (70%) for smartwatches among people who do not already have one. There is a slight skew among individuals aged 30-39 who show more interest in smartwatches, but there are no significant differences among different age or gender groups (please refer to Chart 17).
Chart 17: PURCHASE INTENT AMONG SMART NON-OWNERS
Sample size N=696/128/140/191/237/335/361
Base: smart watch non-owners all respondents (Total)/18-29 y.o./30-39 y.o./ 40-49 y.o. /50+y.o./male/female
*Top 2 boxes: people declaring rather/definitely interested; Bottom 2 boxes: people declaring rather/ definitely not interested
Manufacturers should increase their efforts to popularize the use of smartwatches by encouraging a healthier lifestyle overall. In order to accommodate users’ varying health goals, it may be beneficial to provide a pre-defined list of health metrics that users can select based on their goals and desired timeframe for achievement. In addition, users should be educated about these specific health metrics, including their value in tracking health and the optimal levels to strive for. A periodic report can be provided to users to track their performance in relation to their goals and what they have achieved so far.
Methodology Note
The data presented in this document are based on the on-line study executed in 8 countries: the United Kingdom, Germany, Poland, Spain, Italy, Romania, Bulgaria, Turkey between 12.09 – 28.09.2023, on a representative sample of about N=1000 aged 18-64.
:quality(30)/business-review.eu/wp-content/themes/business-review/assets/images/no-picture.png)

:quality(80)/business-review.eu/wp-content/uploads/2024/06/COVER-1-4.jpg)


:quality(80)/business-review.eu/wp-content/uploads/2024/06/br-june-2.jpg)